Envestnet MoneyGuide Launches RIA Planning Analytics
Envestnet MoneyGuide Launches RIA Planning Analytics

Free Enhancement to MoneyGuide Elite Put Powerful Analytics Front and Center
by Joel Bruckenstein, CFP
MoneyGuide Envestnet has launched RIA Planning Analytics, a free enhancement to the MoneyGuide platform that is available to all MoneyGuide Pro and MoneyGuide Elite retail RIA licensees. It is targeted primarily at solo practitioners and ensemble firms. It differs from Envestnet Analytics which is a paid product that targets enterprises. The latter pulls data from multiple sources, including the Envestnet platform for a fee. This Analytics package is currently limited to data on the Envestnet MoneyGuide platform and it is available at no charge. “We could never have invested in this state-of-the-art analytics system as a standalone firm”, said Tony Leal, President of Envestnet MoneyGuide. “Our collaboration with the Envestnet Analytics gives us the ability to deliver this valuable tool to our advisor clients at no additional cost”.
How it Works
When an advisor logs into MoneyGuide, they will now see an Envestnet Analytics link under the tools list.
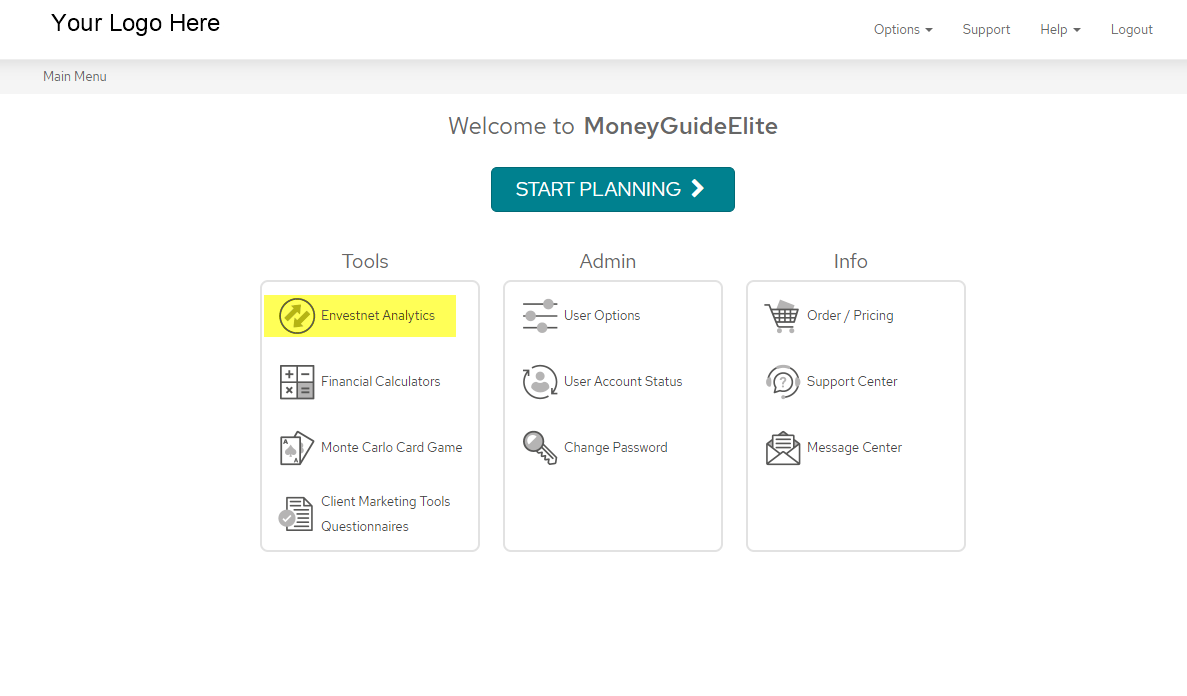
Clicking on the link takes you to the main RIA Planning Analytics dashboard.
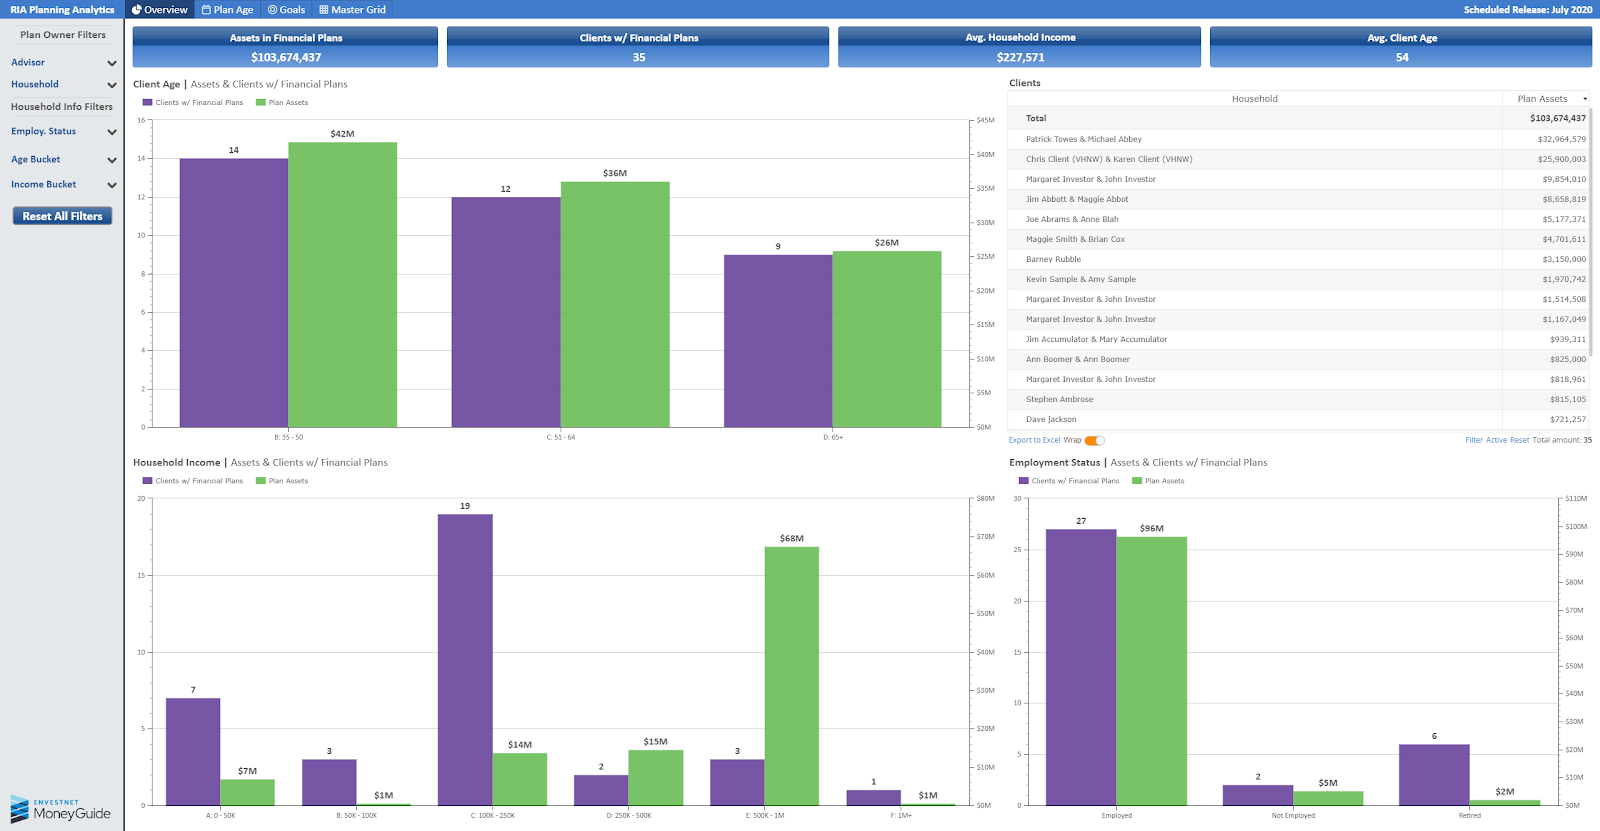
The overview, displayed above, provides a summary across the top of the screen of assets in financial plans, clients with financial plans, average household income, and average client age. The main portion of the screen provides a bit more detail in the four quadrants.
In the upper left, there is a graph that breaks down the number of plans by age group (35-50, 51-64, 65+) and the assets held by each of those age groups. The upper right lists all households with plans, which can be sorted by plan assets. The lower left displays number of plans and assets by household income (0-50K, 50-100K, 100-250K,250-500K, 500K-1M, 1M+). In the lower right, we see clients and plan assets by employment status.
In this sample, we only illustrate three status datapoints (Employed, Not Employed, Retired). It is worth noting that MoneyGuide currently offers two additional status types: business owner and homemaker. If there were clients in the sample data sets that fell into those categories, they would be displayed in the chart. Why is this important? Because the tools and techniques of planning for business owners often differs substantially from those of planning for employees of a firm, so understanding how your client base breaks down across these populations can be useful.
Each of the quadrants displayed here operates independently. In all of the charts, mousing over a bar displays the metric, the category, and the results. Right clicking on a chart allows you to manipulate the data in certain ways. For example, all of the charts here can be converted to a table view by right clicking and choosing the grid option from the menu that appears.
Along the top of the page, you can navigate from the Overview page to an analysis of Plan Age, Goals, or the Master Grid. Plan Age displays how many plans and how many assets fall into each plan age bucket. For example, in my sample data set, only two plans were created seven years ago representing $1 million in assets, but within the last year eight plans were created representing $44 million in assets. If I left click on the bar representing the eight new clients, a chart appears with the name of the clients, plan assets for each, date plan was created, and date plan was last updated. To the right of the graph is a complete list of plans that can be sorted by plan assets, date created, or date updated.
The client goals area has an overview graph of all clients with goals and the type of goals (lifestyle, health, college). There is also a list of every client and the type of goals they have. You can toggle to a more in-depth view of any of the goal types.
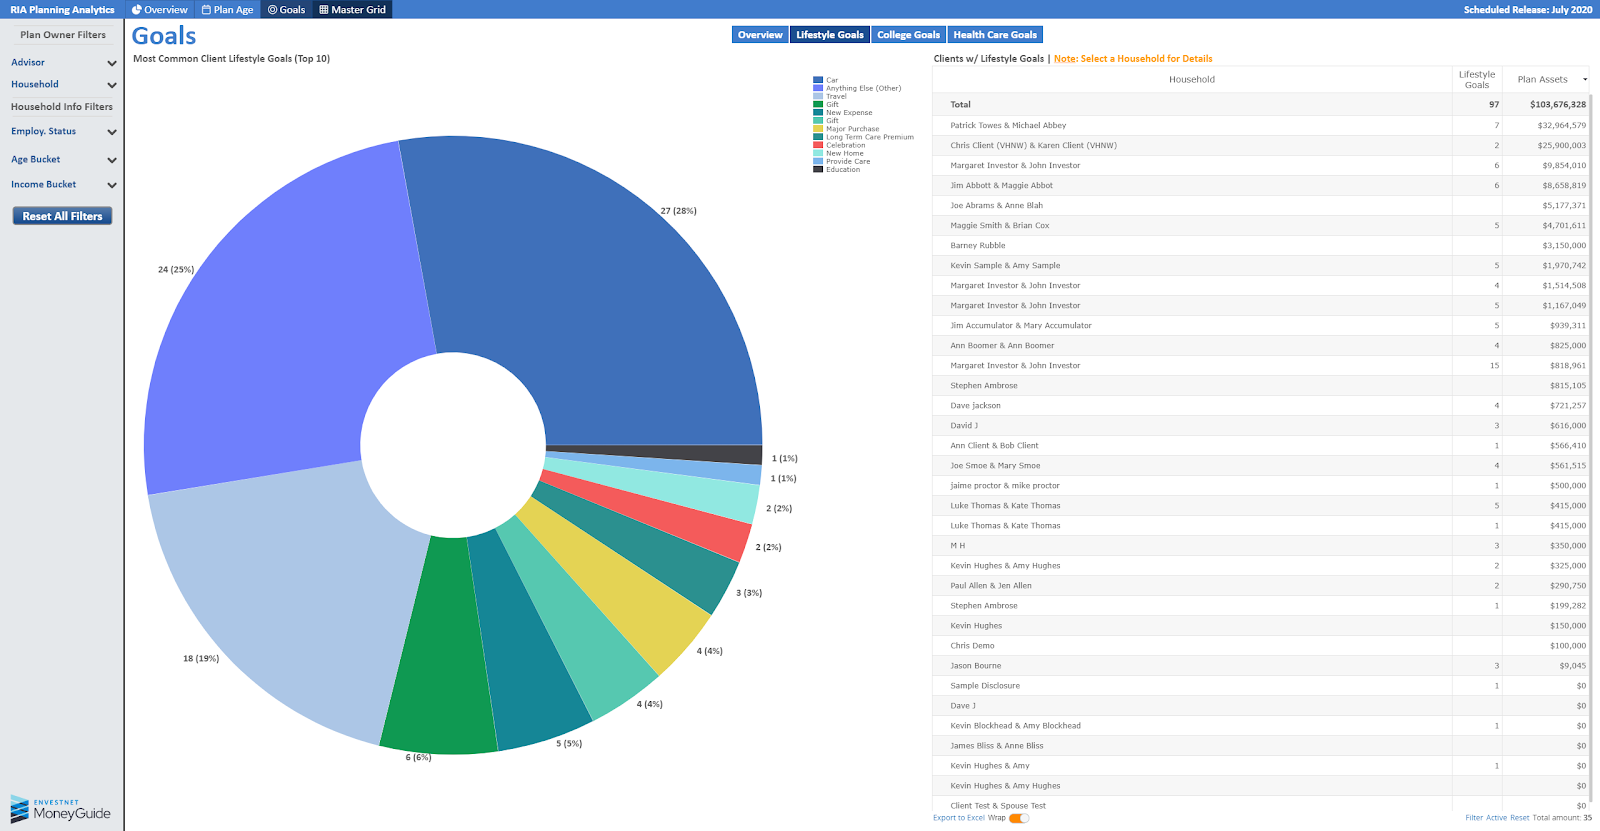
Here, we can see a detailed chart and list of all the goals presented as both a number and a percentage in the pie chart. We also see the list of households and the number of goals per household.
The college view is very straightforward. It displays the number of college goals, wich likely aligns with the number of children below college age, the total college goal in dollars, and the nearest college start date. The health goal is similar. It displays the client and co-client ages plus the goal amount in dollars.
There are filters to the left of the page that are available on most views. These filters allow you to further refine the data. For example, in the goals area, you could sort for all clients age 50-65 and see at a glance which ones do not have a health care goal.
How it Helps Advisory Firms
Advisors are inundated with data, but much of it is either unstructured, or structured in a way that is sub-optimal. RIA Planning Analytics provides structure to much of this data so that it can be acted upon and add value. If, as we showed above, you can easily identify which pre-retirees do not have a health care goal, you can make sure to address the issue in your next client meeting. If you can sort for short term goals and identify clients that may have shortfalls, you may be able to help them borrow to finance the goal where appropriate. Another data point here is whether or not the client has a life insurance policy. You can sort through your younger clients to identify which ones do not have any life insurance.
In the examples so far, we’ve discussed the advisor view of the product. For firms with multiple advisors, firm principals can view the practice in aggregate. Doing so can uncover all sorts of interesting things. To cite just a few examples: Are all advisors consistent in the number of goals their clients are setting? If the clients of some advisors are setting seven or more goals, while others are averaging three or less; there is likely an issue with those advisors with so few goals. Are their patterns by type of goal that vary by age, income, etc. that would be helpful for the firm to identify? Does the firm get more wallet share on average from clients who set more goals? The list goes on.
Another way that RIA Planning Analytics can immediately impact advisors and their firms is by providing advisors with meaningful reasons to communicate with clients. The P&C firm I deal with sends me a birthday card every year, but I know it is computer generated, and it adds no value to our relationship; so I assign zero value to the card. If, on the other hand, they proactively contact me to tell me about a new coverage that would benefit me or a better policy than the one I have, that adds real value. RIA Planning Analytics is a tool that can provide advisors with a great deal of data, as illustrated above, that can initiate an advisor/client communication of substantial value.
My Take
I am very excited about the launch of RIA Planning Analytics. There is a great deal of functionality here that advisors can leverage immediately, and it is free; so what’s not to like? That said, I think that this platform is only scratching the surface of what it can and will be in the future. This platform has the potential to unleash additional creativity and value for years to come.
Let me address some enhancements I think that Envestnet MoneyGuide needs to make. Some of these can be achieved quickly, others will take more time.
Right now, you are limited to the sorting and filtering that the platform provides. The age groups and income buckets, for example, are fixed. You can’t sort for clients age 38-53, or clients with incomes between $75,000-$150,000. In fairness, there is a Master grid that you can export to Excel and then do the types of sorting I mentioned, but to me, that is a temporary workaround at best.
From a data mining/data visualization point of view, this initial version of RIA Planning Analytics just makes me wish for more. I’d love to see some analytics around the MoneyGuide dial and the probability of plan success. Knowing what plans have not been reviewed recently is helpful, but it would be much more helpful to know what plans have had a significant change in the probability of success so that immediate action can be taken.
Some measure of client engagement would be helpful. I want to know who has engaged with the Play Zone, the client portal, etc. If I can identify patterns across client subsets, or across clients of various advisors, that would be valuable information.
I’m told that some benchmarking is already in the works. I expect to see benchmarks for how often advisors update plans vs. other advisors as well as how many goals an advisor is setting vs. some benchmark.
The college goal view today has some value, but it is not nearly what it could be. If I could see whether the plan calls for a public or private college, and if I could see whether there are 529 or Education IRA’s associated with the households, I’d have a much better picture. In the health care goal view, if I knew whether the plan anticipated traditional Medicare or Medicare Advantage, and if I knew the anticipated state of residence in retirement, I’d have a better idea if the health goal had sufficient funding.
I’d like to see the ability to sort for clients of a certain age to see if the advisor had done an Advanced Social Security Analysis or not, and if so, when was it last reviewed. For initial planning when the client is young, using the simple Social Security Analysis with the program defaults might be fine, but as the client enters the pre-retirement years, a more thorough review of Social Security options is in order.
I also want to see some datapoints tracked over time. It is great to know the average client age, but it is much more valuable to track the trend over time. If the average client age is going up steadily, that practice is worth less than one with a steady decline in average age. Asset flows over time is another data set I’d like to monitor. Is there a way to track what percentage of assets are retained when the heads of household pass away? That would also be helpful.
Another area of client engagement that has potential is a deeper tie in with MoneyGuide Blocks. I love MoneyGuide Blocks as both an engagement tool and a planning tool for younger prospects, so expanding RIA Planning Analytics to Blocks can potentially help with client acquisition and client engagement. My understanding is that data from Blocks like data from the full MoneyGuide is part of the data displayed here, but some specific data on how many prospects engage through Blocks, and how many of them are converted to full MoneyGuide relationships over time makes sense. More broadly speaking, tighter integration with both the MoneyGuide and Envestnet platforms is highly desirable. The ability to drill down in context to MoneyGuide from the Analytics tool would be powerful, as would the ability to incorporate Envestnet data analytics into this platform.
Beyond the data enhancements, the next frontier for this platform should be predictive analytics. How will creating plans for more clients impact the value of the advisory business? Which clients are most loyal? Which are most likely to leave in the next year? There are questions predictive analytics can address. There is an opportunity to do some predictive analytics around future spending and a host of other factors too. Predictive analytics can also be used to prioritize tasks. Of the plans that require attention, which ones should the advisor tackle first?
As the investment in this platform grows, my expectation is that some of the above enhancements will continue to be free, but to get much of my wish list, there will inevitably be a cost. That could be a separate fee, or it could be that certain features are only available in Elite as opposed to Pro. I’d gladly pay a reasonable fee to enjoy a more sophisticated, more powerful analytical tool. I think most advisors will be willing to pay for this type of information as well.
My sense is that the launch of RIA Planning Analytics is just the very beginning of a journey that put powerful analytical tools in the hand of advisors. I look forward to seeing where this journey takes us.


